

Energy Outlook 2024: TotalEnergies Sets Out Its Vision for Energy Transition by 2050

Energy Outlook 2024
TotalEnergies Sets Out Its Vision for Energy Transition by 2050
For the sixth year running, TotalEnergies is contributing to the public debate on energy transition with the TotalEnergies Energy Outlook. This document sets out the challenges and issues of energy transition against a backdrop of growing energy demand. The 2024 edition presents three scenarios for change in energy demand and the world energy system up to 2050: the Momentum and Rupture scenarios already presented in previous editions, supplemented by a Trends scenario which reflects the current trajectory of the various countries up to 2030 and anticipates technological developments and public policies in line with current trends.

TotalEnergies Energy Outlook 2024: key messages
- Access to energy is essential to human development and rising living standards, but remains highly uneven from one country to another, against a backdrop of demographic growth.
- The global energy transition is underway. The pace is being set by the United States in particular.
- Three scenarios have been developed for 2050: Trends, Momentum and Rupture. They differ from one other in terms of their decarbonization trajectories, and lead to different temperature rises by 2100.
- There are many driving factors for decarbonization. Low-carbon electrification is key to energy transition.
- Decarbonization technologies must be introduced according to their cost and maturity curve.
- To overcome the obstacles to energy transition and reduce inertia, public policies need to be implemented and international cooperation stepped up.

Global growth and access to energy
Energy is essential to human development
Per capita primary energy demand and the human development index are closely correlated. Today, around 4.5 billion people in the world still do not have access to a sufficient level of energy (less than 70 gigajoules (GJ) per capita) to enable satisfactory human development. Most African countries, and also Asian and Latin American countries outside the OECD, are concerned.
It is thus possible to group the countries of the world, according to their dynamics and the pace of their energy transition, into four blocks:
- The NZ50 block, made up of 44 countries – mainly OECD countries – that have committed to net carbon neutrality by 2050. They account for 1.4 billion inhabitants.
- The China and India blocks, each equivalent in size to NZ50 in terms of population, have a major role to play in energy transition.
- The Global South, comprising all the other countries, with a total population of 3.7 billion.

* The 44 countries, mainly OECD countries, that have committed to net carbon neutrality by 2050 – now including Brazil & Colombia
There are major disparities between these blocks. In India and the countries of the Global South, for example, people have an unsatisfactory level of access to primary energy, even though they aspire to a higher standard of living. For this reason, these countries are likely to see a sharp rise in energy demand in the years ahead.
The blocks themselves are not totally homogeneous: per capita primary energy demand may differ between countries in the same block. This is true, for example, of the United States (280 GJ/capita) and France (133 GJ/capita) within the NZ50 block, or Vietnam (43 GJ/capita) and Angola (19 GJ/capita) within the Global South block. So decarbonization trajectories within the same block could be relatively different.
Disparate dynamics of energy demand
In recent years, each block has seen contrasting changes in its energy system. It is also worth noting that the rise in energy demand is linked more to improvements in living standards than to population growth.
Click on the image to enlarge

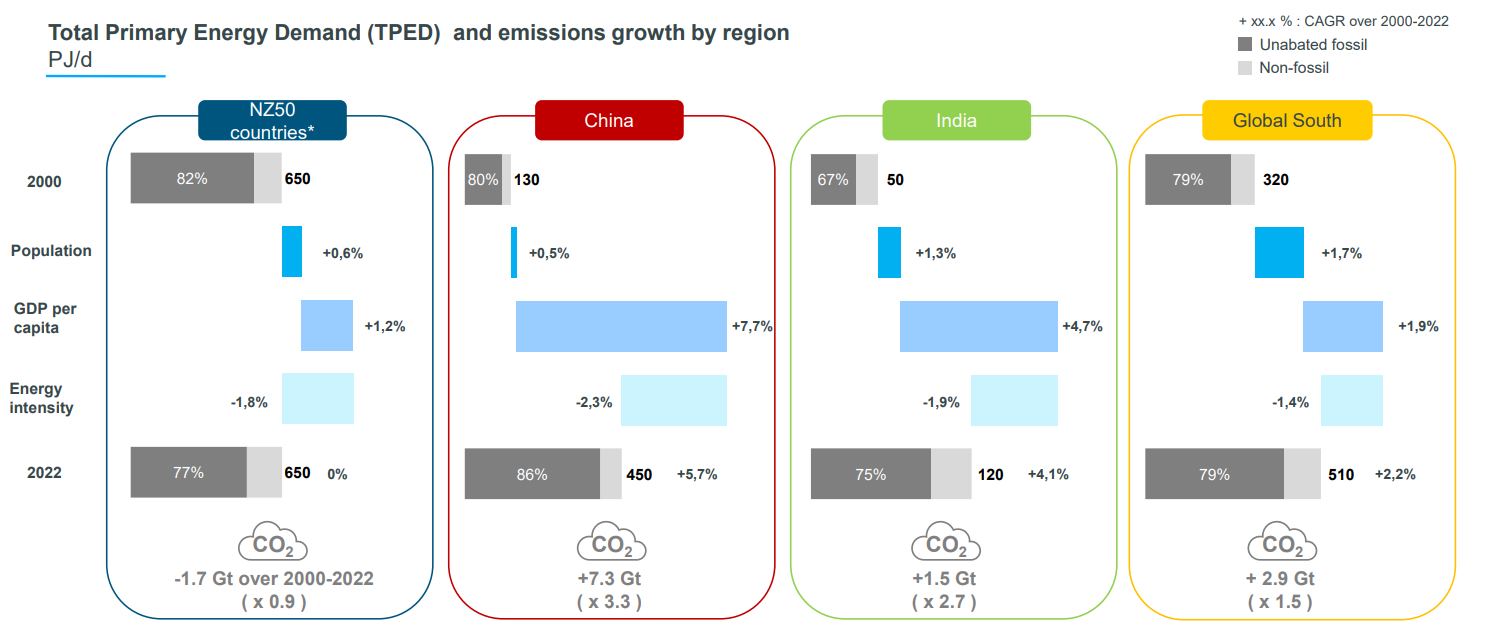
In the NZ50 countries, while primary energy demand remained stable between 2000 and 2022, the share of unabated fossil fuels(1) in the energy mix fell from 82% to 77%, reducing CO2 emissions by around 1.7 billion tons over the period.
Conversely, in China and India, total primary energy demand has risen, accompanied by an increase in the share of fossil fuels. CO2 emissions have multiplied by 3.3 and 2.7 respectively over the period 2000-2022.
Finally, in the Global South countries, primary energy demand rose by 2.2%, while the share of fossil fuels remained stable. At the same time, CO2 emissions rose by around 2.9 billion tons.
(1) Fossil fuels used without significant measures to reduce greenhouse gas emissions throughout their life cycle.
Energy demand projections to 2050

Source: Oxford Economics, Enerdata, TotalEnergies analysis
Demographic growth, and especially GDP growth, govern the level of primary energy demand. Over the next few years, particularly in the countries of the Global South, a growing population aspiring to a higher standard of living should therefore lead to an increase in this demand for energy.
According to the UN, between now and 2050, the world's population is expected to reach 9.7 billions and global GDP is expected to grow by around 2.8% a year. These increases are being driven primarily by the Global South countries, and to a lesser extent by the other blocks.
To reach the threshold of 70 GJ/capita required for satisfactory human development, access to primary energy would need to be tripled, rising to a factor of four by 2050 as a result of the population growth expected between now and then.
Find out more


Energy transition: current situation and outlook
2000-2023: major changes in the global energy system

The rise in greenhouse gas emissions has now been decorrelated from global GDP growth. Electricity demand, however, is growing at almost the same rate as GDP, and growth in renewable energies has accelerated since 2015. Nonetheless, demand for coal – an energy that has a significant cost and availability advantage for the countries of the Global South – is growing almost as fast as renewable energies.
Furthermore, the improvement in energy efficiency is real (1.4% per year between 2000 and 2023), but well below the ambition set by COP28 (3-4% per year). Lastly, demand for oil is growing at roughly the same rate as the population, averaging 1.2% a year over the last 20 years.
The United States sets the pace for the transition
The tight oil and shale gas revolution in the United States has genuinely transformed the American and global energy landscapes. Whereas US liquids production(2) accounted for 9% of global supply in 2010, this share has increased 2.5-fold to 19% by 2023. In addition, US LNG exports, which were non-existent in 2010, have seen unprecedented growth, making the United States the world's leading exporter of liquefied gas in 2023, ahead of Qatar.
At the same time, the United States has reduced its greenhouse gas emissions in absolute terms, by around one billion tons a year. 85% of this reduction can be explained by the use of electricity, as the new abundance of gas has greatly reduced the carbon intensity of electricity generation in the country. The United States is now establishing itself as a major player, setting the pace for energy transition over the coming years.
(2) Including crude oil, condensates, natural gas liquids and biofuels

Reducing greenhouse gas emissions: what are the priorities?
Where do greenhouse gas emissions come from?

Sources: IEA, Enerdata, TTE analysis. « Methane from fossil fuels » includes methane emissions from the production and transport of fossil fuels
* Including heat combined with power
** Includes energy sector own use, transport losses and energy transformation
Global human-generated greenhouse gas (GHG) emissions in 2022 will represent the equivalent of 56 billion tons of CO2. Of these, 38 billion tons are directly linked to energy use, and break down as follows:
- Electricity generation accounts for 14 Gt of CO2e, around two-thirds of which comes from coal alone, even though coal accounts for less than 30% of electricity generation. Coal emits twice as much as gas for the same amount of electricity produced.
- The transportation sector, the second largest source of emissions, accounts for 8 Gt of CO2e, almost all of which is attributable to the use of oil.
- This is followed by industry sectors, energy consumption in buildings and agriculture.
In addition, methane emissions linked to the production of fossil fuels represent 4 Gt of CO2e.
What technologies are needed to reduce greenhouse gas emissions?
By analyzing the main sources of GHG emissions, we can consider and prioritize solutions:
- For electricity generation, replacing coal with renewable energies combined with gas could cut up to 8 Gt of CO2 per year.
- In the transportation sector, electrification could reduce emissions by around 6 Gt of CO2 per year.
- For industry and buildings, the replacement of fossil fuel boilers with heat pumps would reduce emissions by around 2 Gt of CO2 per year.
- Lastly, the solutions developed by the oil and gas industry to reduce methane emissions – for example, by eliminating flaring and purging, repairing and detecting leaks – would enable up to 4 Gt of CO2e to be cut each year.


The main drivers of decarbonization
A number of priority drivers need to be activated to move from one scenario to another and keep the rise in temperatures below +2°C:
- the electrification of end customer practices;
- the decarbonization of electricity generation;
- the development of sustainable mobility; for example, via the widespread electrification of light vehicle fleets and the use of sustainable aviation fuels (SAF);
- an acceleration in energy efficiency, i.e. a reduction in the amount of primary energy needed to produce wealth;
- the use of green gases (biogas and hydrogen);
- plastic recycling;
- CO2 capture and storage (CCS);
- widespread support for the countries of the Global South from the other blocks.
For each of the three scenarios, the changes in these drivers by 2050 are shown in the table below.
| The main drivers of decarbonization | Trends 2050 | Momentum 2050 | Rupture 2050 |
|---|---|---|---|
| Strong electrification of end-use | ~30% of final demand | ~35% | ~40% |
| Deep decarbonization of electricity grid | ~50% of power generation | ~53% | ~62% |
| Improved energy efficiency | +2.3%/year between 2022 and 2050 | +2.4%/year | +2.7%/year |
| Sustainable mobility | ~45% low-emission vehicles in the light vehicle fleet | ~55% | ~70% |
| Sustainable aviation fuel | ~10% of demand | ~35% | ~65% |
| Use of green gas | ~11% green gas in total gas supply | ~16% | ~25% |
| Plastics recycling | ~25% of demand is met by recycled plastics | ~30% | ~45% |
| CO2 capture and storage | ~1.5 Gt (~6% of CO2 emissions) | ~2.7 Gt (~12% of CO2 emissions) | ~6.1 Gt (~44% of CO2 emissions) |
| Support for the Global South | ~30% non-fossil fuels in primary energy demand | ~30% | ~52% |
Find out more

Overcoming the challenges of energy transition
What are the obstacles to energy transition?
The inertia of energy systems
The duration of the transformation of energy systems depends on the useful life of the assets. Two examples highlight the concept of inertia in energy systems:
- The European Union has announced that it will ban the sale of combustion-powered vehicles by 2035. Despite this, combustion-powered vehicles are still expected to account for 20% of light vehicles by 2050. As a result, it will take around twenty years from 2035 to convert the existing fleet of light vehicles to electric power.
- Coal-fired power stations have an average lifespan of around forty years. Given the lifespan of the current power station infrastructure, even if the construction of new power stations were to be banned from 2024, more than a third of power stations would still be operational in 2050.
Inadequate infrastructure
The electrification of end customer practices is one of the keys to energy transition, as demonstrated by the Momentum and Rupture scenarios. However, while renewable electricity production is growing, there is a bottleneck in terms of infrastructure. There are a number of examples to illustrate this:
- The queues for connecting new renewable projects to the electricity grid in the European and American markets are very long. This is mainly due to the fact that licence systems are not adapted to the proliferation of small-scale projects.
- In the United States, there has been little capital expenditure in high-voltage lines over the last ten years. This is both a cost problem and a problem of the acceptability of building new lines.
- Some of the renewable electricity generated by onshore wind and solar power is capped because the grid has insufficient capacity to absorb it. This electricity is therefore lost as a result of the lack of storage and transportation infrastructure.
Overall, we can see that the connection of renewable energies to the grid is lower than their potential, and that once connected, production can be clipped, reducing the incentive to invest.
How can we address the main challenges?
Prioritizing and planning technology deployment
To sustain energy demand, improve living standards and reduce emissions, we need to deploy technologies worldwide, prioritizing them according to cost and maturity. This deployment is to be carried out in three phases.
Phase 1: priority technologies, already mature and produced on a large scale. Examples include electric vehicles, renewable electricity generation assets, LPG for clean cooking and residential heat pumps. These technologies are already competitive, or almost competitive, compared to higher-emitting technologies. Accelerating their commissioning will further enhance their competitiveness and performance.
Phase 2: technologies currently in test phase, to be deployed on a larger scale after 2030, such as CO2 capture and storage, fuel cell electric vehicles and heat pumps in industry.
Phase 3: technologies to be tested in the coming years and deployed after 2040, such as e-fuels or the use of low-carbon hydrogen in industry.
In addition, certain disruptive technologies could facilitate energy transition and the transition from Trends to Rupture.
Click on the image to enlarge

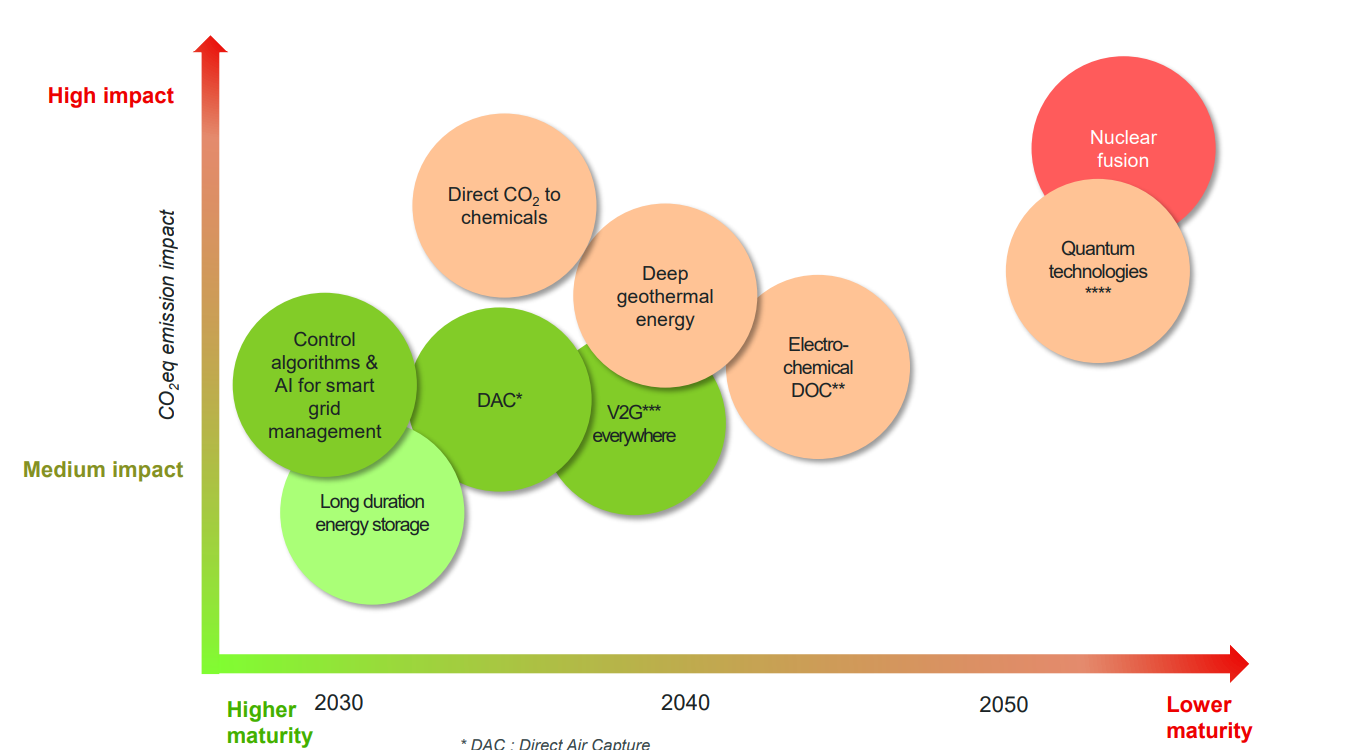
* DAC : Direct Air Capture
** DOC : Direct Ocean Capture
*** Vehicle to Grid
**** Quantum technologies may be used in batteries and solar panels to improve their efficiency
Increasing investment
To remove some of the obstacles to energy transition and achieve the ambitions of the Rupture scenario, a significant increase in investment is needed between now and 2050.

Sources: TotalEnergies analysis, WoodMackenzie, S&P IHS, IEA WEO23
* Not including demand-side investment : buildings, industry, Evs and charging equipments, H2 and CO2 supporting infrastructure
While the level of annual investment in energy systems is already showing good momentum, particularly with regard to the development of renewables, total investment (demand and infrastructure) could be three times higher. Investment in electricity networks faces a number of challenges: rising interest rates, an ageing population, rising defence spending, etc.

From Trends to Breakthrough: what are the priorities?
To move from the Trends scenario to the Rupture scenario and keep the rise in temperature below 2°C by 2100, priority must be given to the large-scale deployment of technologies that are already mature and competitive, in order to:
- facilitate the substitution of electricity for fossil fuels in final demand;
- replace coal with renewable energies combined with gas in electricity generation;
- accelerate the reduction of methane emissions linked to the production of fossil fuels.
To enable this deployment, public policies must focus on:
- allocating grants and defining mandates in line with the merit curve for the cost and maturity of technologies, in order to minimize costs for citizens, and thereby strengthen social commitment;
- eliminating bottlenecks in infrastructure, particularly electricity networks, and speeding up connections to this infrastructure;
- strengthening international cooperation to deploy the cheapest available technologies and develop financial instruments in developing countries.
Find out more