

Energy Outlook 2025: Developments and Outlook for the Energy System to 2050

Energy Outlook 2025
Developments and Outlook for the Energy System to 2050
For the seventh year running, TotalEnergies has published its Energy Outlook to contribute to the debate and discussions around the energy transition. This report shines the spotlight on the major challenges facing a world where energy demand continues to rise, while responding to the climate emergency. After reviewing the changes and developments since the 2015 Paris Agreement, the 2025 edition of the Energy Outlook sets out the three scenarios for 2050, i.e. Trends, Momentum and Rupture, before focusing on decarbonization opportunities for going beyond Trends.

Access to energy is essential for addressing development needs
Today, nearly 4.6 billion people still do not have access to a sufficient level of energy to enable satisfactory human development, particularly in terms of health and education (source: Vaclav Smil, Energy and Civilization, 2019). Our collective challenge involves meeting this legitimate demand, especially in emerging countries, while driving down greenhouse gas emissions as part of our “More energies, less emissions” strategy.
The issues have been clearly identified, such as reducing the emissions from electricity generation, the largest source of energy-related emissions on Earth with 14 billion tons of CO2 per year, and particularly cutting coal-fired power generation, which accounts for 10 billion tons of CO2 per year, and lowering the carbon intensity of mobility (the second largest source of emissions) and heat generation for industry and the residential sector.

Looking back: what has happened since the 2015 Paris Agreement?
The carbon intensity of the global energy system is falling
Global energy demand has continued climbing, fueled by rising living standards in China and emerging countries. CO2 emissions have also increased, but their growth has slowed since 2015, which illustrates the increasing “decorrelation” between growth in energy demand and lower growth in emissions. The carbon intensity of the energy mix has improved. Even though the world is still in the phase of “rising energy consumption”, the transition is already gaining traction in developed countries and drawing closer in other countries, especially China. This transition is supported by the significant inroads that renewable energies have made in global electricity generation and the electrification of end-use, particularly road mobility in China.
Click on the image to enlarge


Where do greenhouse gas emissions come from?
Click on the image to enlarge


GHG: GreenHouse Gases Sources: IEA, Enerdata, UNEP, CITEPA, EDGAR, TTE internal analysis
* Includes methane emissions from the production and transport of fossil fuels and bioenergies
** Includes heat combined with power
*** Includes energy sector own use, transport losses and energy transformation
United States: energy independence and lower emissions
Between 2015 and 2025, the discovery and exploitation of tight oil and shale gas radically transformed the US energy landscape. The country evolved from a net importer to a net exporter of gas in 2017 and petroleum products in 2020, while cementing its reputation as a major force in the global LNG market.
This energy independence has been accompanied by a 21% reduction in emissions since 2005, out of which coal-to-gas switching in electricity generation accounts for 85%. As a result, the carbon intensity of the US electricity mix has continued to fall, which reflects a pragmatic transition where gas plays a key role as a transition fuel.
China: rise of a clean energy superpower
In less than 20 years, China has forged its reputation as a world leader in low-carbon technologies by integrating into all their value chains. This swift transition has culminated in the country’s dominant position in most clean energy supply chains (rare-earth element refining, manufacture of photovoltaic cells, batteries, polysilicon, and so on).
The country also leads the way when it comes to electric vehicle sales, with rapid growth in its electric vehicle fleet (14 % of light vehicles in 2025). However, this dominant position entails a number of internal challenges, including domestic overcapacity risks and the need to incorporate these technologies into a reliable and flexible energy system.
China illustrates the key reality that the global energy transition widely depends on its industrial and technological choices.
Challenges of decarbonizing electricity
Global electricity production has risen sharply since 2000, driven by economic growth and demand from emerging countries. Renewables have played a major role, since 80% of recent electricity growth has come from low-carbon sources, mainly solar and wind power. However, coal continues to dominate in many regions.
- Electricity is achieving progress, but faces a number of structural and economic challenges:
- Due to the sharp fall in photovoltaic solar panel prices, the cost of producing one MWh of electricity with solar panels is now extremely low, which is estimated to be around $55/MWh in Europe. Nevertheless, since solar power is only produced for a few hours each day (around 20% of the time), and electricity demand is not restricted to daylight hours when the sun is shining, its production cost cannot be legitimately compared with the cost of other dispatchable generation methods, such as gas or nuclear power plants. A more credible comparison would be the cost of producing a 24/7 reliable baseload. In this case, solar power and storage cost around $100/MWh, which is slightly more than a gas-fired plant, including a price of $80 / ton CO2. CO2 pricing seems essential for accelerating the competitiveness of low-carbon solutions.
- Current infrastructure is unable to effectively absorb intermittent renewable generation (grid congestion, lack of transmission and distribution lines, increasingly frequent negative prices, etc.). Transmission and distribution networks need expanding, while planning and operation need transforming.
- Despite major technological progress and cost declines, barriers to widespread electric vehicle adoption remain (high prices, excessively long charging times and concerns about battery life). In 2024, only 4% of the cars in the worldwide fleet were electric, even though sales are climbing rapidly in China, Europe and the United States.
- Throughout the world, priority is given to energy security and affordability. In India and the rest of the world, coal use rebounded after 2016, as energy demand growth was met by local and affordable coal. In OECD countries, the authorities need to overcome the public’s reluctance to accept the additional costs involved in decarbonizing their energy use, with sales of electric cars and especially heat pumps stagnating.
Find out more


Three scenarios by 2050
TotalEnergies has developed three scenarios to provide clearer insights into the global energy system up to 2050: Trends, Momentum and Rupture.
Trends
The Trends scenario reflects the continuity in current public policies and technological developments, especially in China and Europe. It takes account of the recent acceleration in mature low-carbon technologies, such as solar and wind power for electricity generation, and electric vehicles and heat pumps for energy use, but it also emphasizes that their large-scale deployment is still held back by infrastructure constraints (power grids), geopolitical tensions and high costs.
This scenario assumes that coal demand gradually declines and returns to its 2000 level by 2050. Oil product use continues growing until 2040 before slowly declining, while gas demand rises until 2040 and then reaches a plateau.
As a result, this scenario leads to an estimated level of warming between +2.6°C and +2.8°C by 2100.
Momentum
This scenario describes a more ambitious pathway than current trends, where OECD countries draw close to carbon neutrality in 2050 and China in 2060. It is based on increased electrification, the virtual phasing-out of coal in OECD countries, and a sharp reduction in China, while India is seeing only slight growth in this source. Natural gas plays the role of a transition energy for electricity and industry, and new energy sources like clean hydrogen and sustainable fuels continue gaining a hold in hard-to-electrify sectors. However, in India and the rest of the world, fossil fuels continue to account for a major proportion of energy growth due to a lack of sufficient investments in low-carbon solutions. This scenario would limit global warming to approximately +2.2°C to +2.4°C by 2100.
Rupture
This normative scenario starts from the necessary end point in 2050 to keep the rise in temperatures below 2°C in line with the Paris Agreement. It assumes significantly enhanced international cooperation, which is currently out of reach due to geopolitical tensions and fragmentation. This scenario involves the massive electrification of end‑uses, a sharp increase in low-carbon electricity production, and an accelerated reduction in coal use, which is limited to hard-to-decarbonize industrial sectors. Natural gas maintains a stable share overall, while low-carbon technologies are deployed in all sectors. If this scenario were achieved, global warming would be limited to +1.7°C to +1.9°C by 2100.
From one scenario to another: the main decarbonization levers
A number of priority drivers need to be activated to move from one scenario to another and keep the rise in temperatures below +2°C:
- electrification of end-use,
- decarbonization of the electricity grid,
- an acceleration in energy efficiency, i.e. a reduction in the amount of primary energy needed to produce wealth,
- the development of sustainable mobility; for example, via the widespread electrification of light vehicle fleets and the use of sustainable aviation fuels (SAF),
- the use of more eco-friendly gases (green gas),
- plastics recycling,
- CO2 capture and storage (CCS), and
- support to India and the rest of the world by the other blocs.
For each of the three scenarios, the contribution of the various decarbonization levers by 2050 is detailed in the following table.
| Main decarbonization levers | Trends 2050 | Momentum 2050 | Rupture 2050 |
|---|---|---|---|
| Electrification of end-use | ~33% of final demand | ~36% | ~43% |
| Decarbonization of the electricity grid | ~54% of power generation | ~56% | ~65% |
| Energy efficiency acceleration | +1.9%/yr between 2023 and 2050 | +2,1%/yr | +2,5%/yr |
| Sustainable mobility | ~44% low-emission vehicles in the light vehicles fleet | ~55% | ~73% |
| Sustainable aviation fuel | ~8% of demand | ~24% of demand | ~54% of demand |
| Gas going greener | ~10% green gases in total gas supply | ~14% | ~23% |
| Plastics recycling | ~18% of demand covered by recycled plastics | ~30% | ~40% |
| CO2 capture and storage | ~1,6Gt (~6% of CO2 emissions) | ~2.8 Gt (~11% of CO2 emissions) | ~5.4 Gt (~40% of CO2 emissions) |
| Support to India and the rest of the world | ~30% of non-fossil sources in primary energy demand | ~30% | ~54% |
Find out more

Outlook for the energy system
The three scenarios have several points in common. In other words, electricity demand is increasing considerably, driven partly by new uses, natural gas is gaining ground as a transition energy, and new oil and gas resources need to be developed to combat naturally declining fields.
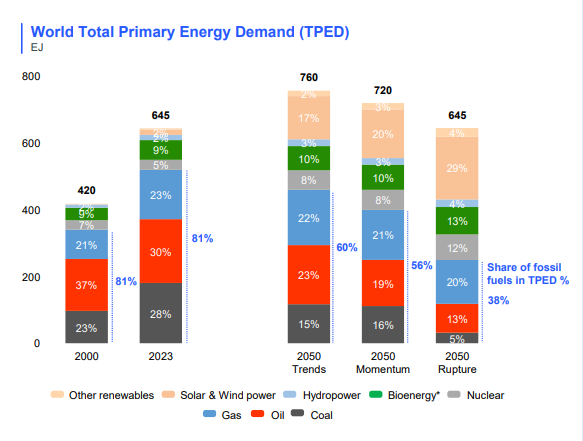
What will global energy demand be in 2050?
In 2050, global demand for primary energy will remain high, but its level and mix will depend on the pathway in question. In all three scenarios, the share of fossil fuels drops from 81% in 2000 to 60% in Trends, 56% in Momentum and 38% in Rupture. Solar and wind power play a central role, which requires a profound transformation of electricity systems and massive investments in electricity grids. Gas continues to be a strategic energy source, particularly for industry, while bioenergy and nuclear power gain in importance.
Click on the image to enlarge

Source: Enerdata, TTE internal analysis
* Bioenergy includes biomass, waste, biofuels and biogas
Energy systems inertia
Even if radical decisions are taken, transforming energy systems will take decades. As coal-fired plants operate for 40 years on average, even with a ban on all new plants from 2025, more than a third of existing capacity would still be in operation by 2050.
The automotive sector reflects the same inertia: even after sales of internal combustion vehicles are stopped in 2035, almost 20 years would be needed to fully renew the global vehicle fleet.
Find out more

Going beyond Trends
Decarbonization opportunities in India and the rest of the world
In India and the rest of the world, low-cost decarbonization opportunities are currently available:
- Electrifying 2- and 3-wheeler fleets could reduce emissions by around 180 MtCO2 per year at a cost of close to $50 per ton of CO2 abated.
- Coal-to-renewables and gas switching in existing electricity generation capacity could cut emissions by up to 2.4 GtCO2 per year at a cost below $60 per ton of CO2.
- Developing a reliable coal-free electricity system to support growth could avoid another 2 GtCO2 by 2050.
The transition in emerging countries not only depends on advanced technologies, but also on pragmatic and affordable solutions that are capable of generating quick and significant gains.

* Includes heat combined with power
** Includes energy sector own use, transport losses and energy transformation
Sources: IEA, Enerdata, UNEP, CITEPA, EDGAR, TTE internal analysis
From Trends to Momentum in Europe
Moving from the Trends scenario to the Momentum scenario in Europe would equate to an additional reduction of 730 MtCO2 by 2050. This would require a complete exit from coal before 2035, massive electrification of buildings (heat pumps, improved insulation, etc.), accelerated EV adoption, and greater use of carbon capture and storage (CCS) in industry and electricity generation.
The financial challenge is still the largest obstacle. According to estimates by the ECB, some €1.2 trillion each year, equivalent to 8.3% of GDP, would be needed to achieve the climate targets, whereas today only an average of €760 billion is invested each year. Therefore, this challenge is not limited to technology: it is based on the ability to raise capital, coordinate policies and maintain social support in the face of profound transformations.
Click on the image to enlarge


* CO2 emissions related to energy combustion, excluding emissions from international trade
** Includes agriculture, transformations and losses of energy
*** BEV: Battery Electric Vehicle, SAF: Sustainable Aviation Fuels
Prioritize high-impact, low-cost actions
Climate policy should take advantage of carbon arbitrage, i.e. focus on emissions, not energy sources, and prioritize the most effective emission reduction actions today to direct limited funding toward where it delivers the greatest impact. To accelerate the energy transition in emerging countries, OECD members need to step up their international cooperation.. This “global carbon arbitrage” would help reduce global emissions more quickly, while limiting the costs for consumers and businesses in developed countries.
Some measures offer substantial reductions in emissions at highly competitive costs, particularly in emerging countries. In other words, it is vitally important to zero in on existing technologies that offer affordable CO2 abatement costs. For example, phasing out 40% of coal-fired electricity generation in India is equivalent to closing the emissions gap with the EU, at a much lower cost than European solutions. The EU should authorize at least 20% offset and channel finance to cost-effective decarbonization projects abroad.

* The Great Carbon Arbitrage, Kleinnijenhuis A., Adrian T., and P. Bolton, INET Oxford University, 2022
** Incremental power system cost from Trends to Rupture in India in 2030, including electricity demand due to faster electrification of usages and coal-to-gas and renewables switching
*** Source: Gollier, C. (2025). L’économie de l’(in)action climatique. PUF.

Find out more